With less than a month away from the Presidential election, there is no shortage of narratives driving the news cycle.
It helps to take a step back and tease out what these storylines mean for markets.
Over the long-term, Presidential elections have been much more noise than signal for investors.
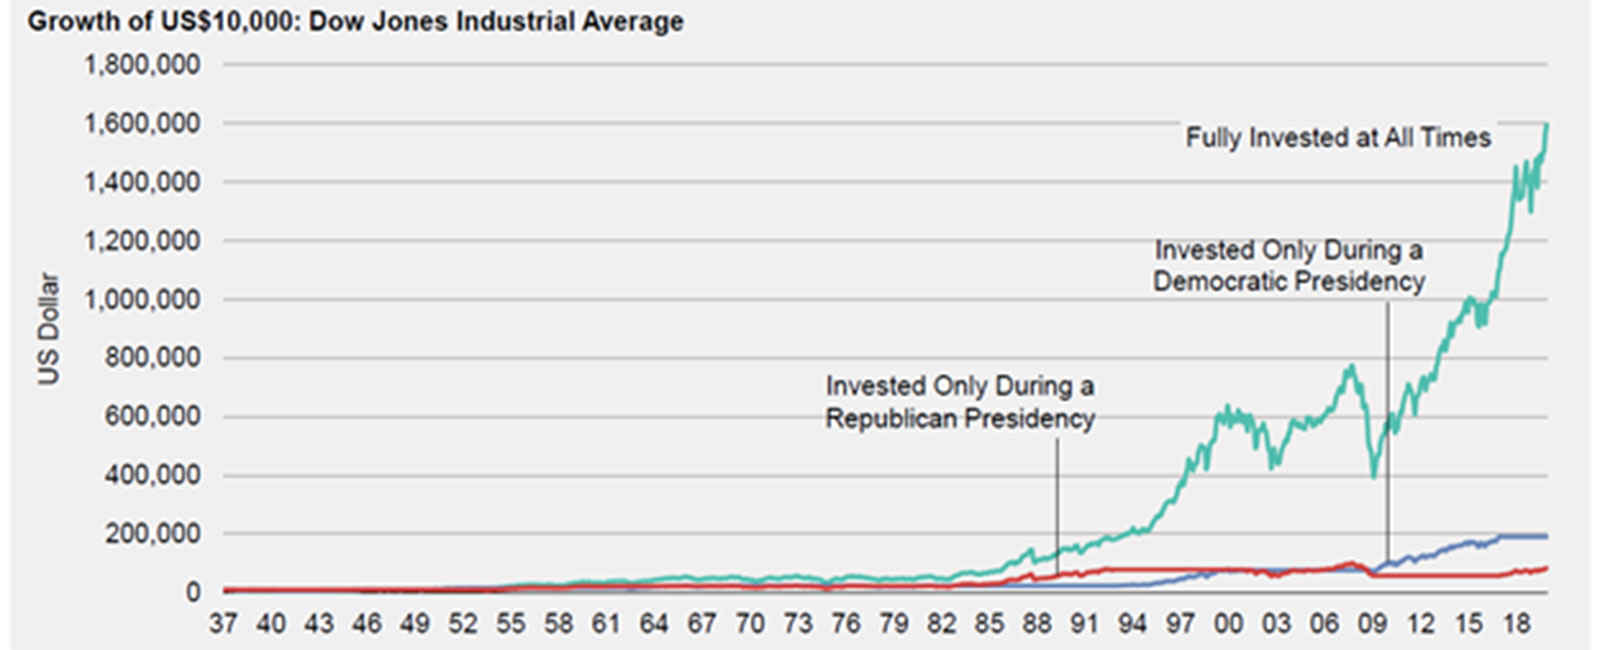
The below chart shows the growth of $10,000 since 1937. If one invested only during Republican presidencies, the result was growth to $100,000. If one invested only during Democratic presidencies, the funds grew to $200,000. Staying invested throughout resulted in the best result – growth to $1.6 million!

Source: Alliance Bernstein
In the short-term, volatility around elections is the rule and not the exception. We should build this into our framework in thinking about how to respond to volatility. In this sense, it is important to have a plan to respond to short term dislocations in the market.
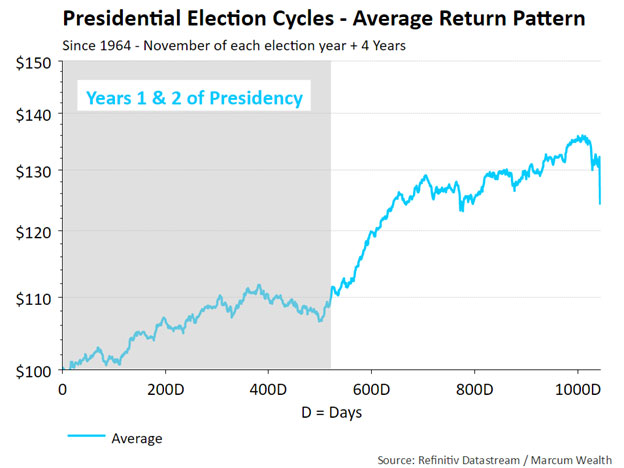
Over the longer term, the returns for markets during the four-year Presidential cycle historically tend to be more muted in the first two years.

The above chart is a useful guide for expectations. Still, the results vary widely in different periods.
In the two years following the last three presidential elections, the market outperformed the average price return of 10%. The market's price return was up 21% in the two years after Obama's 2008 election. It was up 42% in the two years after Obama's 2012 election. After Trump's 2016 win, the market's climbed 32% over the next two years.
Statistically, this is still a small sample size and does not offer enough information for market timing decisions. The old adage that time in the market is more important than timing the market remains true.
Important Disclosure Information
Please remember that past performance may not be indicative of future results. Different types of investments involve varying degrees of risk, and there can be no assurance that the future performance of any specific investment, investment strategy, or product (including the investments and/or investment strategies recommended or undertaken by Marcum Wealth, or any non-investment related content, made reference to directly or indirectly in this commentary will be profitable, equal any corresponding indicated historical performance level(s), be suitable for your portfolio or individual situation, or prove successful. Due to various factors, including changing market conditions and/or applicable laws, the content may no longer be reflective of current opinions or positions. Moreover, you should not assume that any discussion or information contained in this commentary serves as the receipt of, or as a substitute for, personalized investment advice from Marcum Wealth. Please remember to contact Marcum Wealth, in writing, if there are any changes in your personal/financial situation or investment objectives for the purpose of reviewing/evaluating/revising our previous recommendations and/or services, or if you would like to impose, add, or to modify any reasonable restrictions to our investment advisory services. Unless, and until, you notify us, in writing, to the contrary, we shall continue to provide services as we do currently. Marcum Wealth is neither a law Firm, nor a certified public accounting Firm, and no portion of the commentary content should be construed as legal or accounting advice. A copy of the Marcum Wealth's current written disclosure Brochure discussing our advisory services and fees continues to remain available upon request. Please advise us if you have not been receiving account statements (at least quarterly) from the account custodian.
Historical performance results for investment indices, benchmarks, and/or categories have been provided for general informational/comparison purposes only, and generally do not reflect the deduction of transaction and/or custodial charges, the deduction of an investment management fee, nor the impact of taxes, the incurrence of which would have the effect of decreasing historical performance results. It should not be assumed that your Marcum account holdings correspond directly to any comparative indices or categories. Please Also Note: (1) performance results do not reflect the impact of taxes; ( 2) comparative benchmarks/indices may be more or less volatile than your Marcum accounts; and, (3) a description of each comparative benchmark/index is available upon request.
