Presidential Elections & Market Performance
By Michael McKeown, CFA, CPA - Chief Investment Officer

With less than 75 days until the Presidential election, investors naturally turn more attention towards potential outcomes. Like usual, markets are pricing in more potential volatility leading up to November. This is not 'new' news.
The below chart details market performance around the last nine presidential elections. Markets have not risen at such a steep pace in the preceding six months before the election like in 2020 (neon green line). Also relevant is that markets did not decline 34% over a five-week period in those years like in 2020 either.
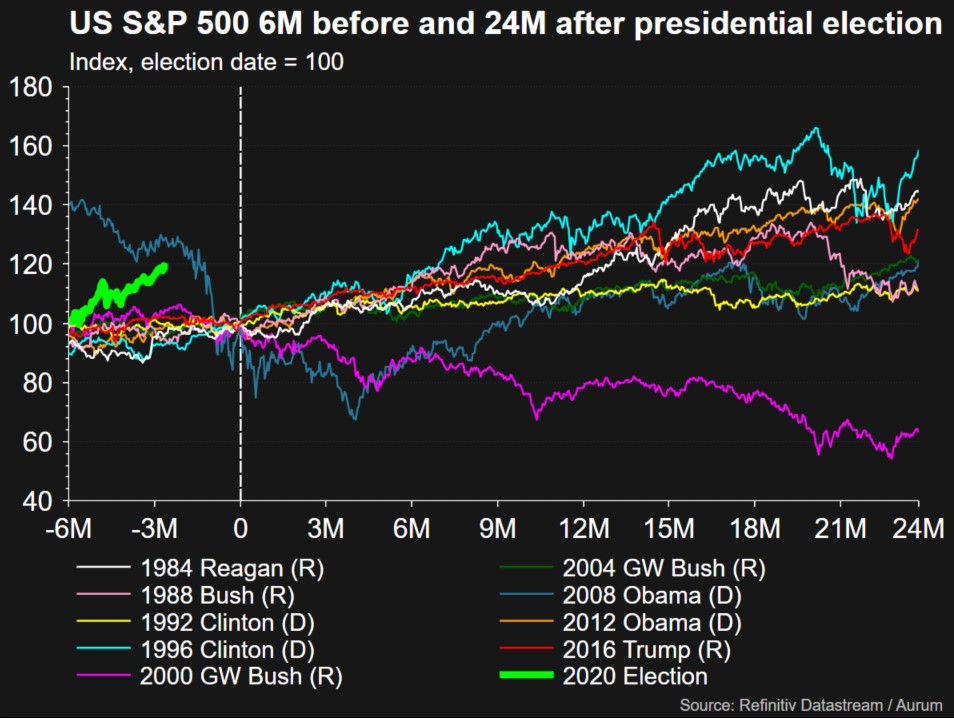
The market was negative six months after the Presidential election in two of the last nine elections. In 2000, the technology bubble was bursting and a recession followed in 2001. In 2008, the mortgage bubble was bursting and it was the middle of the Great Financial Crisis.
Fidelity Investments performed a comprehensive study of elections and market performance since 1789. It broke down the performance on the left of the following chart to show how markets performed in each year of the presential cycle. On average, the stock market does much better in years 3 and 4 of the presidential term. The rationale behind this is that we typically see pro-economic policies enacted to provide stimulus so that the incumbent party may be reelected.
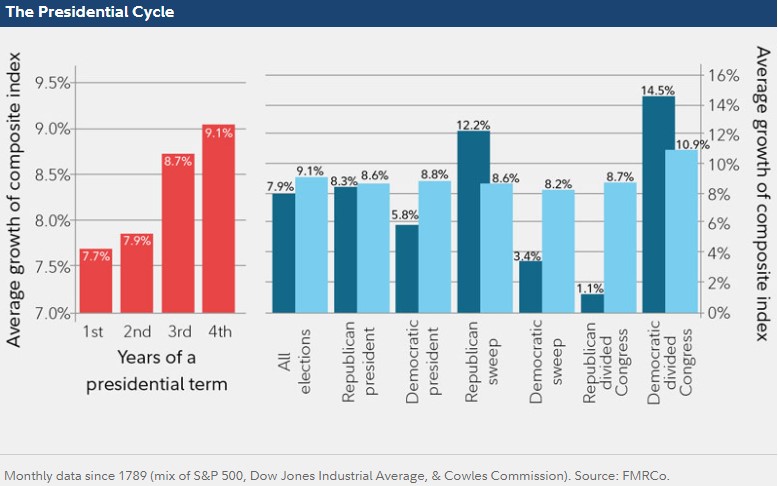
On the right-hand side of the graph in blue bars, we see the performance based on which party was elected president and the breakout of congress. The dark blue bars show the performance over the first two years and the light blue bars show the performance over all four years. The light blue bars average 8% to 11%, regardless of the party in office or split of congress. Looking at the four scenarios on the right of the graph in dark blue, we can see of two of the lowest returns in the first two years come from a Democratic sweep or a Republican President with a divided Congress (3.4% and 1.1%, respectively). A Republican sweep or a Democratic President with a divided Congress resulted in the highest returns over the first two years (12.2% and 14.5%, respectively).
Many investors have asked us about selling stocks because of the upcoming election and the uncertainty around it. However, markets have already anticipated a higher volatility environment. The evidence of this is in the volatility and derivative markets. As the saying goes, 'markets hate uncertainty.' Therefore, a more volatile period is being priced in since the winner is still not clear. An outlier scenario could be a contested election where the winner is not clear on November 3rd, which many political forecasters consider a possibility.
Timing markets is still difficult. Getting out and getting back in means one needs to have two correct timing calls (a sell and a buy back in), along with paying any taxes for the capital gains. Since equities are long duration assets, any liabilities that need met in less than five years should be in cash and bonds. This way, investors need never to be a forced seller. A longer time horizon is an advantage in an era where tweets can move markets and short-term traders look to ride the momentum.
The long-term results of the stock market depend more on valuations, productivity, and the long-term fundamentals of earnings and interest rates. The President is just one piece of the policy puzzle. We believe focusing on the process around asset allocation, the valuations implied, and the price levels one should be trimming or adding to stocks is more repeatable over the long-term.
Important Disclosure Information
Please remember that past performance may not be indicative of future results. Different types of investments involve varying degrees of risk, and there can be no assurance that the future performance of any specific investment, investment strategy, or product (including the investments and/or investment strategies recommended or undertaken by Marcum Wealth, or any non-investment related content, made reference to directly or indirectly in this commentary will be profitable, equal any corresponding indicated historical performance level(s), be suitable for your portfolio or individual situation, or prove successful. Due to various factors, including changing market conditions and/or applicable laws, the content may no longer be reflective of current opinions or positions. Moreover, you should not assume that any discussion or information contained in this commentary serves as the receipt of, or as a substitute for, personalized investment advice from Marcum Wealth. Please remember to contact Marcum Wealth, in writing, if there are any changes in your personal/financial situation or investment objectives for the purpose of reviewing/evaluating/revising our previous recommendations and/or services, or if you would like to impose, add, or to modify any reasonable restrictions to our investment advisory services. Unless, and until, you notify us, in writing, to the contrary, we shall continue to provide services as we do currently. Marcum Wealth is neither a law Firm, nor a certified public accounting Firm, and no portion of the commentary content should be construed as legal or accounting advice. A copy of the Marcum Wealth's current written disclosure Brochure discussing our advisory services and fees continues to remain available upon request. Please advise us if you have not been receiving account statements (at least quarterly) from the account custodian.