Chart of the Week
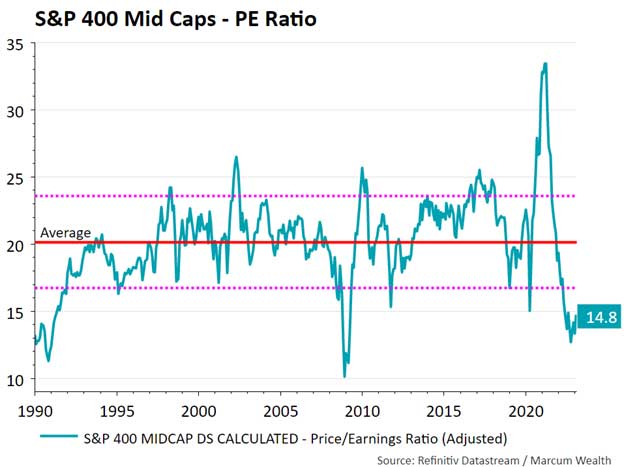
Mid-cap companies in the S&P 400 Index, with an average size of $6 billion, represent a good snap shot of diverse industries and household company names. Analysts lowered mid-cap earnings expectations over the past year and now expect earnings to fall 1% over the next 12 months; in prior downturns in earnings, the forecast has gone down much more. The silver lining is that expectations and the price of those earnings fell dramatically this past year. The price-to-earnings ratio is now below 15, which happened less than 10% of the time since 1990.

What We’re Reading
Everything You Can’t Have – Morgan Housel
Retirement Income and Safe Withdrawal Rates in 2023 – Morningstar
The Road Ahead: Lessons from The 1970s – Man Institute
Finally Catching Up: Is there an Opportunity in Small Caps? – JPMorgan
Podcast of the Week
What Zillow Knows About the Housing Market in 2023 – Top of Mind
The Past Week
The first few days of February were action packed with the Fed slowing rate hikes to 0.25% and the blowout January jobs report. We had a break from major data releases last week. Consumer sentiment improved while jobless claims increased.

The Week Ahead
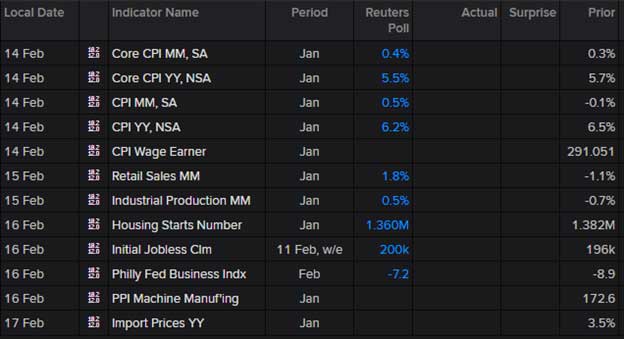
As if it escaped anyone’s mind, inflation comes to the forefront with the monthly CPI report on Tuesday. Economists expect a rise from prior months. The key to watch will be services excluding housing, which the Fed is monitoring and influencing the path of interest rate hikes.

Thank you for reading.
Important Disclosure Information
Please remember that past performance may not be indicative of future results. Different types of investments involve varying degrees of risk, and there can be no assurance that the future performance of any specific investment, investment strategy, or product (including the investments and/or investment strategies recommended or undertaken by Marcum Wealth, or any non-investment related content, made reference to directly or indirectly in this commentary will be profitable, equal any corresponding indicated historical performance level(s), be suitable for your portfolio or individual situation, or prove successful. Due to various factors, including changing market conditions and/or applicable laws, the content may no longer be reflective of current opinions or positions. Moreover, you should not assume that any discussion or information contained in this commentary serves as the receipt of, or as a substitute for, personalized investment advice from Marcum Wealth. Please remember to contact Marcum Wealth, in writing, if there are any changes in your personal/financial situation or investment objectives for the purpose of reviewing/evaluating/revising our previous recommendations and/or services, or if you would like to impose, add, or to modify any reasonable restrictions to our investment advisory services. Unless, and until, you notify us, in writing, to the contrary, we shall continue to provide services as we do currently. Marcum Wealth is neither a law Firm, nor a certified public accounting Firm, and no portion of the commentary content should be construed as legal or accounting advice. A copy of the Marcum Wealth’s current written disclosure Brochure discussing our advisory services and fees continues to remain available upon request. Please advise us if you have not been receiving account statements (at least quarterly) from the account custodian.
Historical performance results for investment indices, benchmarks, and/or categories have been provided for general informational/comparison purposes only, and generally do not reflect the deduction of transaction and/or custodial charges, the deduction of an investment management fee, nor the impact of taxes, the incurrence of which would have the effect of decreasing historical performance results. It should not be assumed that your Marcum account holdings correspond directly to any comparative indices or categories. Please Also Note: (1) performance results do not reflect the impact of taxes; (2) comparative benchmarks/indices may be more or less volatile than your Marcum accounts; and, (3) a description of each comparative benchmark/index is available upon request.
