The Technology Sector & Style Shifts
By Michael McKeown, CFA, CPA - Chief Investment Officer

Technology and growth stocks were the runaway market champions over the last decade. Technology makes up 41% of the large cap growth index and was key to outperforming value.
The ten-year Treasury yield started the decade at 4.0%. There is a loose relationship between growth outperforming and yields falling. With a longer duration of growth in the future, these stocks benefited from falling interest rates.
However, the trend shifted over the last six months. Value stocks have taken back their former mantle won from 2000 to 2007, at least for now. Part of the reason for this is interest rates increasing. The ten-year Treasury increased from 0.6% last summer to 1.6%
There is a chance interest rates will remain lower for longer if the economy remains in a lower gear as in the last decade. Technology and businesses that can maintain high growth may continue receiving a premium in this environment.
Investors caught onto the growth trend the last decade as money flowed to this area of the market. This pushed the technology sector (plus Amazon, which is a consumer stock) to be a third of the S&P 500 Index (which tracks the largest companies in the U.S.).
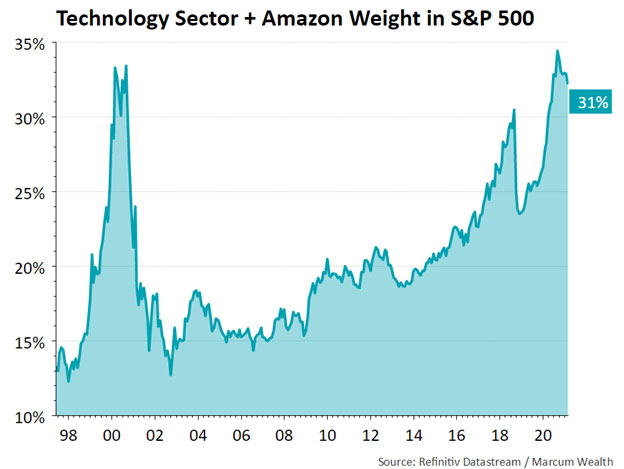
From 1998 to 2000, the weighting in the S&P 500 Index for technology spiked higher from 13% to 33%. After the NASDAQ plunged 80% from 2000 to 2002, not many people were excited about technology stocks in the mid-2000s. It made up only 15% of the index at the time. For the last 15 years, technology made a much more gradual climb to the 34% level last year, now sitting at 31%.
Credit is due to the innovation created by these companies. It led to huge revenue growth and profits. Technology is more profitable than 21 years ago. Back then, the top 10 names in the S&P 500 Index made up 25% of the index but only generated 16% of the earnings. Today, the top 10 names make up 28% of the index but contribute 26% of the earnings.
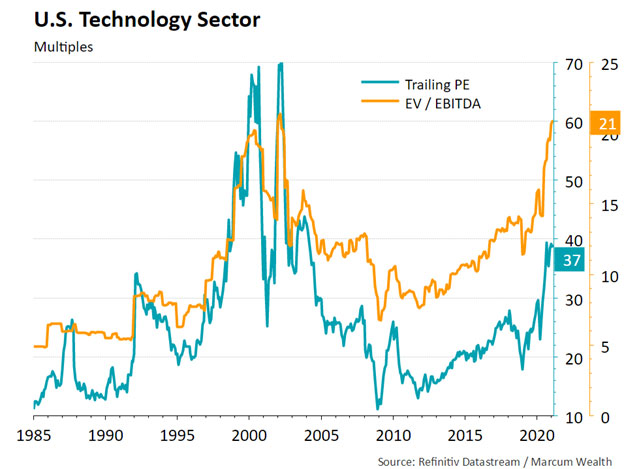
The multiples on technology are high on an absolute basis. This matters because it is the price for every dollar of earnings or cash flow an investor is paying. Below we show the Trailing Price to Earnings (PE) ratio in teal and the Enterprise Value to EBITDA (Earnings Before Interest Tax, Depreciation, and Amortization) in orange. In 2000, the PE ratio hit above 70 while today it sits at 37. The EV/EBITDA multiple is now at 21, matching its high in the technology bubble.
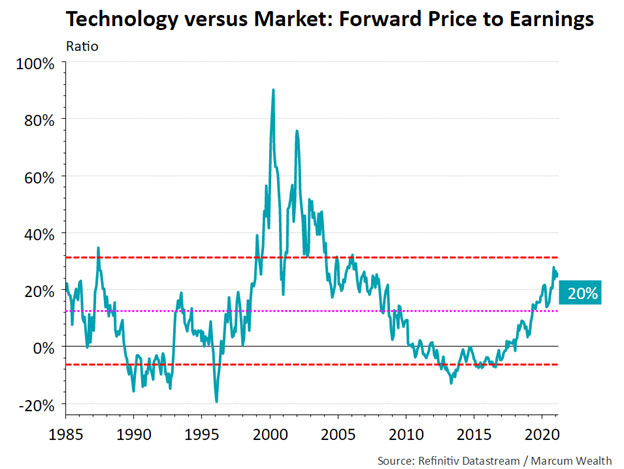
Compared to the broader market, the multiples are not that extreme. Technology averaged a 12% premium on a Forward Price to Earnings ratio basis since 1985. Today it is at 20%, though recently at the higher end of its normal range.
A decade ago, the BRIC acronym was the winner by a landslide (Brazil, Russia, India, & China). These countries were the top performers from 2002 to 2010.
The popular FAANG acronym (Facebook, Apple, Amazon, Netflix, Google) has become synonymous with investing success the last decade. The largest tech stocks outperformed strongly as innovation led to exponential growth.
The setup and fundamentals are different than the 2000 bubble peak. Yet the acronym for winning the decade of the 2020s and the most widely known in 2030 will likely be different than today.
Investment strategies, managers, styles, asset classes, and sectors all have their time in the sun. Falling in love with a single one does not typically lead to great long-term results. Exposure to a variety of strategies that can do well across economic regimes is a more robust approach.
Important Disclosure Information
Please remember that past performance may not be indicative of future results. Different types of investments involve varying degrees of risk, and there can be no assurance that the future performance of any specific investment, investment strategy, or product (including the investments and/or investment strategies recommended or undertaken by Marcum Wealth, or any non-investment related content, made reference to directly or indirectly in this commentary will be profitable, equal any corresponding indicated historical performance level(s), be suitable for your portfolio or individual situation, or prove successful. Due to various factors, including changing market conditions and/or applicable laws, the content may no longer be reflective of current opinions or positions. Moreover, you should not assume that any discussion or information contained in this commentary serves as the receipt of, or as a substitute for, personalized investment advice from Marcum Wealth. Please remember to contact Marcum Wealth, in writing, if there are any changes in your personal/financial situation or investment objectives for the purpose of reviewing/evaluating/revising our previous recommendations and/or services, or if you would like to impose, add, or to modify any reasonable restrictions to our investment advisory services. Unless, and until, you notify us, in writing, to the contrary, we shall continue to provide services as we do currently. Marcum Wealth is neither a law Firm, nor a certified public accounting Firm, and no portion of the commentary content should be construed as legal or accounting advice. A copy of the Marcum Wealth’s current written disclosure Brochure discussing our advisory services and fees continues to remain available upon request. Please advise us if you have not been receiving account statements (at least quarterly) from the account custodian.
Historical performance results for investment indices, benchmarks, and/or categories have been provided for general informational/comparison purposes only, and generally do not reflect the deduction of transaction and/or custodial charges, the deduction of an investment management fee, nor the impact of taxes, the incurrence of which would have the effect of decreasing historical performance results. It should not be assumed that your Marcum account holdings correspond directly to any comparative indices or categories. Please Also Note: (1) performance results do not reflect the impact of taxes; (2) comparative benchmarks/indices may be more or less volatile than your Marcum accounts; and, (3) a description of each comparative benchmark/index is available upon request.